National Roads Network Indicators 2017

[This post was drafted last summer but only completed and uploaded to the website in January 2019.] 

Last year, TII published the National Roads Network Indicators 2017 which is their annual report on the state of Irish national roads. This includes national primary roads, national secondary roads and motorways although the report also includes some data on regional and local roads.

screenshot 2019-01-23 at 10.47.41

Following the same format as last year, the report is divided into the five sections, four of which are considered below:

  1. Road Network – presenting key statistics on the components of the road network
  2. Safety – looks at the number of fatalities in the network and whether the network is getting safer or not
  3. Accessibility and Environment – impact of investment on employment accessibility
  4. Economic – looks at overall travel demand.


Road Network

One of the interesting facts thrown up in the report is that 88% of roads deliver the highest level of Service A ie free flow conditions with 96-97% of roads delivering Level of Service C which is minimum stable flow.

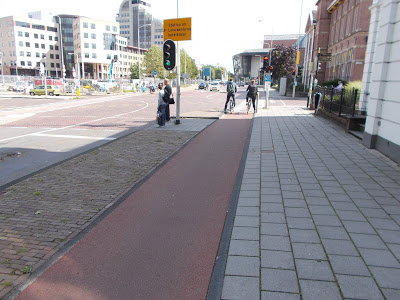
The comparison with the Level of Service for cycle facilities is striking. Most cycle facilities offer the lowest level of service ie D. These include most of the greenways developed even those which have been hyped and spun as world class. They also include many schemes in urban areas  where the allocation of space is the minimum for cycling but above minimum for motorised traffic. Local authorities consider such schemes to be in accordance with DMURS despite the hierarchy of road users prioritising cyclists above car drivers.

As in 2016, 39% of trips were estimated to be less than 15 minutes in duration and 38% of trips were less than 10km in length. There was also no change in the average trip distance at 19.4km and average trip duration at 22 minutes. Once more it shows the potential to substitute trips by bicycle if the government was to properly #Allocate4Cycling by providing adequate funding and specifying high standards.

The annual growth rate in traffic on the network was 3.0% nationally in 2017 compared to 4.6% in 2016. In the mid-east which includes Kildare and the other commuter counties surrounding Dublin the growth rate was 4.4% in 2017 and 5.2% in 2016. If maintained at this rate, the growth in traffic on national roads between 2016 and 2025 will be almost 50%.

SAFETY

In the section of safety, TII pulled two sleights of hand in their presentation of road fatality statistics.

The 2017 Report gives a reduction of 28% between 2013 and 2017 (64 to 46 fatal collisions) but this disguises the fact that there had been a significant increase (72) in the number of fatal collisions in 2016 which the report  ignores.

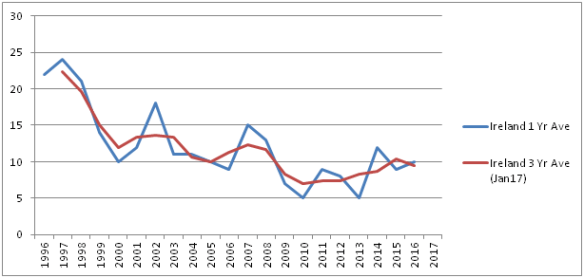
The three year average of fatal collisions on national roads is as follows:

Year 2013 2014 2015 2016 2017
Fatal Collisions  on National Roads 64 66 61 72 46
3 Year Average of  Fatal Collisions on National Roads 65.0* 63.7 66.3 59.7 59.0*

Table 1         Three Year Average of Road Fatalities on National Roads

* These are averaged over  2 years only as the third year is not available

The percentage difference between 2013 and 2017 is only of the order of 8% which is very different from the 28% reported.

The second sleight of hand is in relation to the different reporting periods. The 2016 report considered six years (2011-2016) whereas the 2017 report considered five (2013-2017). If they had used a period of 5 years in 2016 as in  2017, the change in fatalities would be from 48 (2012) to 72 (2016) – an increase of 50% which would take the gloss off the TII performance.

ACCESSIBILITY & ENVIRONMENT

The 2016 report states that a key benefit of a quality road system is improved accessibility to jobs which is generally seen as positive. The Impact of Road Investment on Job Accessibility between 2013 and 2017 shows this in graphical form. In practice however, this is seen in induced demand – longer commutes, more congestion in the urban areas and more noise and air pollution for those living in city centres and urban areas which are negative consequences.

ECONOMIC

The philosophy of TII in relation to traffic growth ( and by extension to climate change) is clearly set out in this section. The report states

Trends in overall employment in the economy drive commuting traffic whilst personal incomes are the major determinant of non-commuting traffic. With regard to the carriage of goods, economic output is the major determinant.

These statements are half right but simplistic. The underlying assumption is that the growth in commuting (motorised) traffic on national roads will be by private car. In the absence of any change in funding by the Department of Transport from roads to active travel, it excludes the possibility that there will be major increases in the number of people using sustainable modes of transport such as walking, cycling and public transport as required by National Transport Authority’s Statement of Strategy 2018-2030 and Smarter Travel. It also ignores policies on climate change and the potential risk of paying millions of euros for failing to meet our international obligations to reduce carbon emissions.

In considering 2017 and beyond, the report states

Given ….. economic trends, the prospects are for continued significant growth in National Roads traffic overall and HGV traffic in particular.

As cyclist fatalities have increased with increasing traffic over the last eight years, this is hardly good news for cyclists.

Cycle Tracks Should Be Laid In Red Asphalt — The Ranty Highwayman

Quote

Ever since my first visit to the Netherlands in the summer of 2015, I have been obsessed with the use of red asphalt for cycle tracks (OK, the Dutch do design quite well generally).The main reasons are that using a coloured surface helps to provide visual priority in situations such as cycle tracks crossing side…

via Cycle Tracks Should Be Laid In Red Asphalt — The Ranty Highwayman

Cyclist.ie Press Release : Dept of TRANSPORT & RSA – BLIND TO CYCLISTS’ FATALITIES

The Department of Transport Tourism and Sport (DTTaS) and the Road Safety Authority (RSA) can rightly claim responsibility for the large decrease in road fatalities over the last thirty years. However,  in claiming a reduction in road fatalities in 2018, they are blind to the trend of increasing cyclist fatalities since 2011 and by failing to properly allocate for safer cycling, the DTTaS perpetuates a road and traffic environment where cyclist safety is secondary.

The DTTaS and the RSA are very concerned about the number of fatalities on Irish roads. At the end of each year, they respond to the annual number of fatalities and welcome the results if the number goes down and lament if the number goes up. Their benchmark for success or failure of road safety policy is annual number of fatalities relative to the previous year. This is a good yardstick when the numbers involved are relatively large. When the number is relatively small, as in cyclist fatalities, the total for consecutive years can vary widely.

If, however, the number of fatalities is averaged over three years the effect of large swings is reduced and longer term trends are discernible. Analysis using a three year average shows that cyclist fatalities were at a low point in 2011 but have since risen significantly  – more than 50%, albeit over seven years. Other countries which have significantly increased the level of cycling, have done so while simultaneously reducing the number of fatalities.

Colm Ryder, Chair of Cyclist.ie, the Irish Cycling Advocacy Network, states “The increasing level of cyclist fatalities in Ireland is unacceptable. To address this as a matter of urgency, the DTTaS must begin to properly allocate for cycling”.

The DTTaS currently spends less than 2% of its transport capital budget on cycling.  To maximise the contribution of cycling to reducing carbon emissions and increase health and environmental outcomes, the Minister must increase expenditure to 10% of the Land Transport capital budget, and not to 10% of the Public Transport budget as recently announced. The Intergovernmental Panel on Climate Change has reported that the next twelve years are critical to prevent global warming  beyond 1.5o. The  clock is ticking ……..

For Attached Graph and Table, see below

181222 Cie DTTaS Press Release Ver2


END


Reference: RSA/Garda Siochana, Provisional Review of Fatal Collisions January to 31  December 2018 pdf 

Cyclist.ie Press Release – CLIMATE ACTION: MINISTER ROSS MUST INVEST IN CYCLING

The following press release appeared in the Examiner on 21st December.

The Government’s recently published Annual Transition Statement 2018 has ignored the potential for cycling to reduce transport emissions.  The legislation is designed to enable Ireland’s transition to a low carbon, climate resilient and environmentally sustainable economy by 2050. However, the section of the Statement dealing with the decarbonising of the transport sector  demonstrates a complete failure by Minister Ross and his Department to grasp the potential contribution that cycling can make to a reduction in carbon emissions.

Transport accounts for over 52% of energy used in Ireland and is increasing. It is one of the four key areas where a reduction in carbon emissions is required to meet our international obligations. Section 4.4 of the Annual Sectoral Mitigation Statement deals with decarbonising transport and states that this involves providing meaningful alternatives to the private car, continuing investment in sustainable transport and promotion of modal shift.

However, in the accompanying National Mitigation Plan Actions, a different narrative unfolds – one where rhetoric is divorced from anything remotely approaching meaningful action.

The Update Report on Actions contains a section entitled “Actions not delivered as planned”. It includes words like “publish”, “review”, and “strategy” rather than “fund” and “enable”. Six of the actions were due to be completed by the Department of Transport Tourism and Sport in 2017. These include “Publish a review of the National Cycle Policy Framework” which originally commenced in 2013 and which 5 years on has still not been completed.

Under Actions Complete, the Decarbonising Transport section lists five items.  The DTTAS were responsible for two – setting up a behavioural change working group and publication of a Greenway Strategy. Greenway funding is welcome but it is disingenuous to claim that publication of a strategy or the setting up of a working group will reduce emissions and it is noted that no estimate of emission reduction is included.

The recent IPCC report clearly spells out the urgent need to reduce carbon emissions in order to limit global warming to 1.5°C. To minimise environmental damage and  fines arising from the failure to meet Ireland’s climate change targets, Minister Ross must adopt much more ambitious actions than currently outlined. Cycling is the mode of transport for more than 40% of people in many progressive European cities.  Cycling will not solve the problem of climate change on its own, but as 57% of Irish journeys are less than 8 km, it can make a significant contribution as well as alleviating congestion, contributing to cleaner air, improving health outcomes and creating attractive neighbourhoods, For cycling to play its part however, Minister Ross must begin to properly fund high quality cycling infrastructure which will enable cycling for all.

“Cycling offers the best and quickest return on investment of all transport expenditure. We urgently need to invest a minimum of 10% of transport funding in cycling infrastructure, to give people a safe, attractive alternative to the car” says Gerry Dornan, Vice Chairperson of Cyclist.ie, the Irish Cycling Advocacy Network.

Nearly two thousand years ago, the Emperor Nero is reputed to have fiddled while Rome burnt. In the next few years we shall see if our current leaders will emulate him or take decisive action to stop climate change.

END

2019 Cycling Allocation – 1.26% Transport Capital Budget?

Investment in cycling is difficult to estimate. Central government provides funding, local government provides funding, other government bodies provide funding and some infrastructure and/or finance is provided by developers as part of planning conditions.

Irish cycling advocates have long been interested in the level of investment by central government but even there the exact level is difficult to uncover. Efforts by different politicians and parties to find out through parliamentary questions  were unsuccessful with replies carefully crafted to avoid answering the questions. The Minister has made periodic statements about funding both inside and outside the Dáil  but cycling is lumped in with walking or the Minister talks in terms of sustainable travel which also includes investment in buses and trains. If you were to ask most Irish politicians “How much does the government spend on cycling?” – they would have no idea. In countries with high levels of cycling, politicians do know – perhaps not expenditure in a specific year but they have a headline figure which the government aims for.

In Ireland, expenditure in the Department of Transport, Tourism and Sport is subdivided into five programmes – (1) Land Transport, (2) Civil Aviation, (3) Maritime Transport and Safety, (4) Sports and Recreational Services and (5) Tourism Services. Of these, Land Transport is the most important area receiving over 90% of the total budget.

The table below gives a breakdown of Land Transport expenditure for 2018. The figures are taken from the Revised Estimates Volume for Public Services 2018 which was published in December 2017. In the future, these will be reclassified as provisional figures before the actual expenditure outturns are finalised, as shown in the annual Appropriation Accounts. The government provides a similar level of detail on expenditure for all departments but does not give a breakdown of expenditure at  lower levels.

2018 Current Non Pay Current Pay Pension Capital Grand Total
 B.1 – Administration – Pay 12,460 12,460
 B.2 – Administration – Non Pay 2,237 295 2,532
 B.3 – Road Improvement/maintenance 72,207 19,160 2,130 815,356 908,853
 B.4 – Road Safety Agencies & Expenses 1,853 2,774 139 350 5,116
 B.5 – Vehicle And Driver Licencing Expenses 15,900 3,500 19,400
 B.6 – Carbon Reduction 5,500 5,500
 B.7 – Public Service Provision Payments 281,713 18,650 300,363
 B.8 – Public & Sustainable Transport Investment Programme 1,605 398,940 400,545
 B.9 – Public Transport Agencies & Expenses 2,819 2,830 11 5,660
 B.10 – Miscellaneous Services 78 78
Total €378,412 €37,224 €2,280 €1,242,591 €1,660,507

TABLE 1       Land Transport Expenditure 2018  (€ 000)
                     (Source: Databank Department of Public Expenditure & Reform)

Most areas in Land Transport receive negligible capital investment. The two which stand out are Road Improvement/Maintenance at €815M (or 65% of the total) and Public & Sustainable Transport Investment Programme at €398 (or 32.1% of the total).  This clearly demonstrates the disparity between the capital allocation for roads as opposed to all other modes of transport including cycling.

Public Transport & Sustainable Transport is the main source of funding for cycling. However, funding for cycling  is also provided under other programmes. For example, in 2018 greenways were funded under the Tourism programme while investment in a velodrome appeared under Sport. This article  concentrates on the departmental funding of cycling from Public Transport & Sustainable Transport but also includes Greenways.

We have identified eight areas of expenditure which involve provision for cycling but the same funding may also be used to provide for other modes of transport. In order to estimate the contribution to cycling alone, it is necessary to separate/estimate what proportion of funding goes to cycling and what goes elsewhere.

  1. Bus Connect

Expenditure on Bus Connect is estimated at €79M in 2018. The primary reason for this expenditure is the need to reorganise the bus service. It is considered reasonable that a proportion should be allocated to cycling as the project includes the provision of segregated cycle facilities on part of the Bus Connect network. It was decided to proportion 10% for cycling as that is the government target for cycling. There are grounds for arguing that 10% is too high and other arguments that 10% is too low but as Bus Connect is a new project, it was decided that 10% was reasonable until its outcome in relation to the provision of cycling infrastructure is clear.

  1.  Cycling/Walking

Cycling/Walking has been allocated €8M in 2018 rising to €15 in 2019. In the absence of any further information from the Department, it was considered reasonable to divide the allocation 50:50 betweeen the two modes.

  1.  Sustainable Transport  Mobility Grants (STMG)

STMG has been allocated €14M in 2018. It may be thought that a large percentage goes to cycling but STMG also includes public transport and walking projects. The proportion of 25% was estimated on the basis of the NTA Outturn Reports.

  1.  Smarter Travel Workplaces

The allocation for Smarter Travel Workplace is estimated at €0.60M per annum. Again, it is an area which includes other modes of transport with cycling only accounting for 33% of expenditure.

  1.  Green Schools

The allocation for Green Schools is also modest at €1.65M but once more the proportion which is spent on cycling is low. The proportion of 33% was estimated from Annual Reports from Green Schools.

  1.  Greenways

Greenways are funded under the Tourism heading and are primarily for recreational reasons as public lighting is not generally provided and Waterways Ireland insist on a low quality dust surface which deters many utility and sport cyclists. Greenways, if constructed to a high standard, have the potential to cater for utility cyclists. Therefore, it was thought fair to include their expenditure in order to estimate overall departmental spending on cycling.

  1.  Cycle Right

All funding for Cycle Right goes to cycling.

  1.  Bikeweek

All funding for Bikeweek goes to cycling.

A breakdown of Department funding for cycling for the years 2018-2021 is given in the Table 2. Some of the funding is current rather than capital spending but has been included to get an overall figure for Department spend.

 Area of Expenditure 2018  2019  2020  2021 TOTAL 
Bus Connect
Bus Connect €79.00 €143.00 €246.00 €282.00 €750.00
Cycling Contribution (10%) €7.90 €14.30 €24.60 €28.20 €75.00
Cycling/Walking
Cycling/Walking €8.00 €15.00 €35.00 €52.00 €110.00
Cycling Contribution (50%) €4.00 €7.50 €17.50 €26.00 €55.00
STMG
STMG €14.00 €17.00 €47.00 €57.00 €135.00
STMG Cycling Contribution (25%) €3.50 €4.25 €11.75 €14.00 €33.75
Smarter Travel Workplaces
Smarter Travel Workplaces €0.60 €0.60 €0.60 €0.60 €2.40
STW Cycling Contribution (33%) €0.20 €0.20 €0.20 €0.20 €0.79
Green Schools
Green Schools €1.65 €1.65 €1.65 €1.65 €6.60
Green Schools Cycling Contribution (20%) €0.33 €0.33 €0.33 €0.33 €1.32
Cycle Right
Cycle Right (100%) €0.65 €0.65 €0.65 €0.65 €2.60
Greenways – Tourism
Greenways €0.00 €13.45 €15.2 €24.35 €53.00
Greenways Cycling Contribution (50%) €0.00 €6.73 €7.60 €12.18 €26.5
Bikeweek
Bikeweek (100%) €0.40 €0.40 €0.40 €0.40 €1.60
DTTAS Expenditure on Cycling €16.98 €34.36 €63.03 €81.96 €196.31

TABLE 2       Departmental Allocation & Contribution to Cycling 2018-2021 (€ M)

In 2018, total expenditure is estimated at €16.98M rising to €34.36M in 2019. The #Allocate4Cycling campaign seeks 10% of the Land Transport Capital budget to be devoted to cycling. As the Land Transport capital budget is estimated at €1243M and €1544M in 2018 and 2019 respectively, this level of expenditure on cycling equates to 1.37% and 2.22% for those years – a long way from what is required to significantly impact on health, congestion, sustainability and climate change.

Of the eight areas of expenditure, the total allocation for four (Smarter Travel Workplaces, Green Schools, Cycle Right and Bikeweek) is negligible at €1.6M per annum. The allocations for Greenways and Cycling/Walking are significant  but most of the funding is in the latter years of the investment programme which shows a lack of priority by the Minister. While he did announce greenway funding of €53M in 2018, no significant if any funding will be spent this year as councils have until November to make an application for schemes. Furthermore, it is assumed that 50% of the Cycling/Walking allocation is for cycling.  In theory it could be anything between 0.1% and 99.9% and still accord with statements by the Minister.

  2018 2019 2020
DTTAS Expenditure on Cycling €9.08 €19.45 €39.40
DTTaS Total Capital Voted Expenditure €1,243.00 €1,544.42 €1,934.52
% Cycling 0.73% 1.26% 2.04%

TABLE 3       % of Departmental Expenditure on Cycling 2018-2020
                      Excluding Bus Connect (€ M)

By far,  the largest area of expenditure  is  the  Bus Connect  project with  contributions to cycling of €7.9M  and  €14.3M in  2018   and  2019.  It  hardly  needs  to be pointed out  that  Bus Connect is  running into problems politically with very vocal opposition to the proposed reorganisation  of bus  routes. If  there  are delay to  routes,  no preliminary  or  detailed designs  can proceed  so it is more than  likely  that any expenditure  on cycling  routes adjacent  to key bus routes  will not  happen  until  the end of  2019  or later.  If  so,  the proportion of  Land Transport capital expenditure allocated to cycling in 2018 and 2019 could fall as low as 0.73% and 1.30% respectively (see Table 3) and  this for a mode of transport which is used for more than 40% of journeys in many Dutch and Danish cities. The Minister has been quoted as saying that his Department “gets” cycling. Unless there is openness on his intended levels of investment,  its impact on levels of cycling  AND a commitment to substantial funding, cycle advocates will continue to disagree.

PS      For  comparison,  Finland,  which  is  similar  in  population  to  Ireland,  has  just announced funding of  €23M for a single cycle project,  albeit the most expensive in its history.


10% of Land Transport Budget – #Allocate4Cycling

budget submission_Twitter Photo

Cyclist.ie members, including Maynooth Cycling Campaign, have put together a strong budget submission addressed to Minister for Finance & Public Expenditure Paschal Donohue, outlining the deficiency in government funding supports to enable cycling to grow. Essentially we are calling for an immediate 10% of Land Transport Funding to be allocated to Cycling, to enable the government to meet its own target of 10% of modal share by cycling by 2020. Currently the modal share stands at only approximately 3% of trips by bike, and funding levels are at approximately 2% of Land Transport Funding!

The Cyclist.ie submission points out that the appropriate funding for cycling aligns with numerous government policies and initiatives across a variety of sectors such as Transport, Environment, Climate Change, Health, Business, and Education. Cycling, as a mode of transport, offers numerous well documented benefits to society, including:

  • Improved public health
  • Reduced congestion
  • Reduced greenhouse gas emissions
  • Reduced air and noise pollution
  • More liveable and sociable streets and communities, and
  • High rates of economic return

Unlocking these benefits requires targeted and sustained investment, and international evidence demonstrates that investing in cycling provides excellent value for money.

From available data we estimate that spending on cycling currently only amounts to approximately 2% of Transport capital spending. This compares to recommended targets of 10% for cycling, and present European levels of between 5% and 8%. This very low proportion is not commensurate with the benefits offered by cycling, or with the significant economic costs which car dependence imposes on Irish society. To encourage people to make more journeys by bicycle;

We call for 10% of the capital budget for land transport to be invested in cycling.

At the same time, an increase in current spending on a range of different objectives which can support a transition to a cycling friendly society is also required.

The full budget submission is available here and a short summary document here. We need YOU to contact your local representatives and make the case to increase funding for cycling. See https://www.whoismytd.com/ for the names and contact details of your local TDs.

IT NEEDS TO HAPPEN NOW!

Government & RSA Blind to 73% Increase in Cyclist Fatalities


There has been outrage among cyclists at the number of cyclist fatalities  in 2017 – fifteen according to the Gardaí and sixteen according to others. While the Gardaí may debate whether one was a pedestrian or a cyclist, the facts are that last year 16 cyclists left home never to return alive.

Analysis of cyclist fatalities is usually based on a 12 month period. However, this gives rise to a number of ‘spikes’  because of the relative low level of fatalities. A more useful  analysis – one that reduces the effect of spikes and reveals trends more clearly – comes from using a three year average calculated from the year before, the year in question and the year after. Figure 1, which was calculated in January 2017, shows the 1 Year Average and 3 Year Average Cyclist Fatalities for the period 1996 to 2016.  The 3 Year Analysis  shows that since 2010 there has been an increase in cyclist fatalities with the increase appearing to have eased slightly at the end of 2016. Note that the figure for 2016 was averaged over two years (2015 and 2016) as it was estimated in January 2017.

Fig1

Figure 1:              1 Year and 3 Year Average Cyclist Fatalities 1996-2016 (Jan 2017)

In December 2017, the figure for 2016 was recalculated to include the 2017 cyclist deaths and an additional year 2017 was included by again averaging the fatalities over the last two years (2016 and 2017).

Fat3

Table 1:              1 Year and 3 Year Average Cyclist Fatalities 2007 (Dec 2017)

Figure 2 below shows the revised graph which was derived in part from the table above.  As stated above, the 3 Year Average for the final entry (2017) was calculated over two years 2016 and 2017.

Fig2

Figure 2:           1 Year and 3 Year Average Cyclist Fatalities 1996-2017 (Dec 2017)

The real scandal of increasing cyclist deaths is not the spike in the first half of 2017 but the  upward annual trend from 7.0 fatalities in 2010 to 12.5 fatalities in 2017 – an increase of more than 78% –  which has gone unnoticed by both the government and the RSA. This equates to an annual increase of some 8% each year for 7 straight years.

In 2017 some of the fatalities were recreational cyclists – others were utility cyclists. Some accidents occurred in urban areas while others occurred in rural areas. Many commentators have remarked that there is no pattern to the deaths but this is not the case.  Table 2 below lists the 2017 fatalities and the type of road on which the fatal collision occurred.

Table 2:                List of Cyclist Fatalities 2017 and Road Type

All the fatal accidents involved at least one other vehicle. Excluding Paul Hannon who was technically a pedestrian as he had dismounted from his bike at the time of the accident, eleven of the remaining 15 cyclists were either on national, regional  or city arterial roads. Thus, over 73% of fatalities happened on roads with high levels of traffic and/or high speeds – roads on which segregated cycle facilities would be provided in other countries as a matter of course but not in Ireland.

There are three main areas through which cyclist safety can be improved:

  • High quality infrastructure
  • Enforcement
  • Promotion/advertising

Infrastructure is the most capital intensive area and can take a significant period of time to show change at a national level. With government expenditure on cycling at €2.5 per head per annum, little high quality infrastructure and with no commitment to radical change, it is apparent that the government is prepared to settle for an “acceptable” level of cyclist deaths. The number of fatalities may spike somewhat from year to year (as in 2017) but with the levels of utility cycling virtually stagnant[1], the number of fatalities is unlikely to increase significantly enough to force change.

Enforcement of legislation is a matter for the Garda Siochana. The inadequacy of the Gardaí response to drink driving has received a lot of publicity and has still to be satisfactorily  resolved. Looking at international practice, the work of the West Midland police and their Close Pass Operation which led to a 20% decrease in the number of cyclist killed and seriously injured has been widely praised by cyclists advocacy groups. It is a good example of police enforcement and should be a model for the Gardaí to follow.

Infrastructure and enforcement are the two most effective areas and the areas on which the Irish government should focus. The third area – promotion (advertising) – is the least effective but involves little funding so, needless to say, it is the area where the Irish government concentrates its efforts. Everyone is aware of road safety and no motorists (or very few) go out with the deliberate intention of killing another road user. However, people are human and make mistakes.  To address fatalities, cyclists don’t need  empty gestures from the Gardaí/RSA such as Go Slow Days, pledges to go slow or EDWARD (European Day without a Road Fatality).  There is approximately one road fatality every second day in Ireland so there is a 50:50 chance of no fatality on 21st September. In 2016, EDWARD coincided with two fatalities in Donegal yet the Gardaí/RSA choose to repeat the exercise in 2017 and disappointingly the Dublin Cycling Campaign actually wanted to be associated with it. What is most depressing is that even in countries with high levels of cycling, it took a large number of dead cyclists – more than 100 of them children in a single year in the 1970s – to motivate Dutch politicians to take the matter seriously. The question is what is the threshold of dead cyclists for Irish politicians to take action? We know that in 2016 two child cyclists were killed including one going to school. This has had no impact on   politicians so obviously two is not enough.  For those who think that this is unfair on politicians, we are still awaiting a response from the body politic to the news from the EPA that air pollution in Ireland, principally caused by car traffic, causes 1200 premature deaths every year.

[1] Based on Census results, the level of commuter cycling in 2016 is at the level which previously occurred around the year 2000.

This article was amended to include the death of Pat Beakey whose fatality was omitted in the original. His inclusion increases the rise in fatalities since 2010 from 71% to 78% (ie from 7 to 12.5 instead of to 12).

NTA Makes Dog’s Dinner of Cycle Quality

The NTA have made a dog’s dinner of cycle facility quality. Yes they are concerned about quality and yes they refer to it in the National Cycle Manual but does anyone outside the NTA really understand it?

When people are booking a hotel, they have an understanding of the ‘Star’ system of ranking. They may not understand the difference between a 2 star and 3 star hotel but they understand that a 3 star hotel is more luxurious or offers better facilities than a 2 star one and would expect to pay more for it (all other things being equal).

So what is the story with the quality of cycle facilities? There are five levels of service – A+, A, B, C and D. Any cycle facility which does not fall into the first four is level D. Width is one of five determinants of quality the other being number of conflicts, percentage of HGVs on the route, pavement condition and journey time delay. (There has been some modification to pavement condition as a result of the development of the Greater Dublin Cycle Network but the amendments have not been incorporated into the written or digital Manual.) Width is by far the most important determinant, so what does the Manual say about width and level of service? The Manual assesses width in terms of the number of adjacent cyclists as shown below.

So is the width of Level C the same as Level D? And is the width of Level A the same as Level B? What is the width of a Level A facility? In Section 1.5.2, there are references to widths of five cycling regimes but the Manual does not state if the cycling regimes correspond to the Level of Service, and furthermore the exact meaning of different regimes is unclear and open to interpretation. For example what does basic two way mean?

Section 1.5.1 of the Manual on Determining Width includes the following
The designed width of a cycle facility is comprised of the effective width, i.e. the
space that is “usable” by cyclists, as well as the clearances that will be required in
different circumstances.

Effective width as opposed to designed or constructed width is a very important concept as it takes conditions on either side into account. This is important as local authorities often provide a 2m wide cycle track with kerbs adjacent to the footpath on one side and adjacent to a traffic lane on the other, which only has an effective width of 1m.

To make matters worse, the Manual defines the minimum width of a shared footway as 3m, but whether this is effective width or designed/constructed width is not clarified and it does not define whether this is one way cycling shared with two way pedestrians or two way cycling shared with two way pedestrians. The MAnual does not take the level of use into account. As 3m is the minimum standard in accordance with the National Cycling Manual, it is assumed that the level of service for cycling is the fifth and lowest category ie D. Then, just when you think that the NTA couldn’t complicate things further, they succeed.

In 2015, they published a Permeability Best Practice Guide which also has five levels of service but in this case they are A,B,C, D and E. Section 3 of the Guide defines widths for the different Quality of Service (see below) but doesn’t define whether these are effective or constructed widths.

Permeability Quality of Service

The Best Practice Guide states that local authorities in urban areas should aim to provide a Level A quality of service for any pedestrian or cycle links between residential areas and destinations such as schools and shops. Not unreasonably, the document goes on to point out that Level A will often be unachievable due to constraints but at least sets out a high target.

So where does that leave the common situation that arises where one section of a route has segregated cycle facilities and the next section has a 3m wide shared footway? Using the permeability criteria, the shared section is ranked category B and C (second and third) but using the National Cycle Manual criteria, it is D (fifth). What would you think of an organisation which ranks a hotel as one star, three star and four star at the same time? The idea of a star ranking is good. It gives cycle campaigners, politicians and the general public a crude but convenient assessment of quality. However, the time to properly define its use is long overdue.